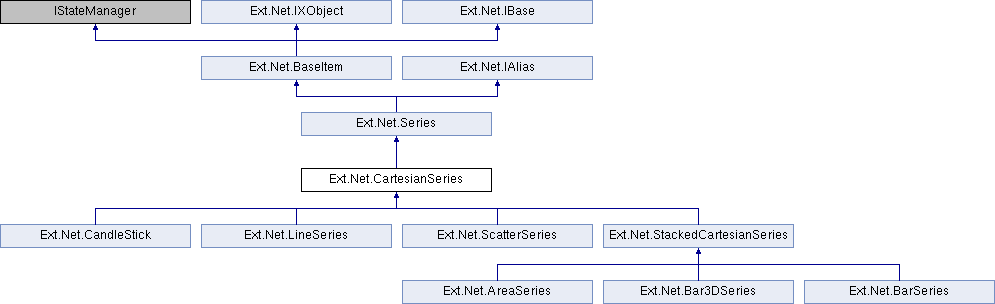
Common base class for series implementations that plot values using cartesian coordinates.
More...
|
| override string | InstanceOf [get] |
| | The JavaScript class name More...
|
| |
| virtual ? bool? | DataGapsHandling [get, set] |
| | This enables the series' ability to handle gaps in data while estimating the chart's scale (when scale is calculated at run time and not fixed). More...
|
| |
| virtual ? int? | XAxisIndex [get, set] |
| | For charts with multiple x-axes, this defines which x-axis is used by the series. It refers to the (zero-based) index of the axis in the chart's axes config. Is is superseded by XAxisID. More...
|
| |
| virtual string | XAxisID [get, set] |
| | For charts with multiple x-axes, this defines which x-axis is used by the series. It refers to axis' ID in the chart's axes config. Is supersedes XAxisIndex. More...
|
| |
| virtual string | XField [get, set] |
| | The field used to access the x axis value from the items from the data source. More...
|
| |
| virtual ? int? | YAxisIndex [get, set] |
| | For charts with multiple y-axes, this defines which y-axis is used by the series. It refers to the (zero-based) index of the axis in the chart's axes config. Is is superseded by YAxisID. More...
|
| |
| virtual string | YAxisID [get, set] |
| | For charts with multiple y-axes, this defines which y-axis is used by the series. It refers to axis' ID in the chart's axes config. Is supersedes YAxisIndex. More...
|
| |
| virtual string[] | YField [get, set] |
| | The field used to access the y axis value from the items from the data source. More...
|
| |
| override ConfigOptionsCollection | ConfigOptions [get] |
| |
| override string | InstanceOf [get] |
| | The JavaScript class name More...
|
| |
| DrawBackground | Background [get, set] |
| | Sets the background of the surface the series is attached. More...
|
| |
| virtual string[] | Colors [get, set] |
| | An array of color values which is used, in order of appearance, by the series. Each series can request one or more colors from the array. Radar, Scatter or Line charts require just one color each. Candlestick and OHLC require two (1 for drops + 1 for rises). Pie charts and Stacked charts (like Column or Pie charts) require one color for each data category they represent, so one color for each slice of a Pie chart or each segment of a Column chart. For a Gauge chart it is an array of color values which is used for the needle and the sectors. It overrides the colors that are provided by the current theme. More...
|
| |
| virtual bool | Hidden [get, set] |
| | True to hide the series More...
|
| |
| virtual bool | Highlight [get, set] |
| | If set to 'true', the default highlight style from highlightCfg will be used. Defaults to false. It is superseded by the HighlightConfig property. More...
|
| |
| virtual SpriteCollection | HighlightConfig [get] |
| | The sprite attributes that will be applied to the highlighted items in the series. It will be merged with the highlightCfg. In case merging of 'highlight' and 'highlightCfg' configs in not the desired behavior, provide the 'highlightCfg' instead. It supersedes the Highlight property. More...
|
| |
| virtual SpriteCollection | HighlightDefaults [get] |
| | The sprite attributes that will be applied to the highlighted items in the series. It will be merged with the highlightCfg. In case merging of 'highlight' and 'highlightCfg' configs in not the desired behavior, provide the 'highlightCfg' instead. More...
|
| |
| ChartLabel | Label [get, set] |
| | The config of Series' Labels More...
|
| |
| virtual ? int? | LabelOverflowPadding [get, set] |
| | Extra distance value for which the labelOverflow listener is triggered. More...
|
| |
| virtual SpriteCollection | Marker [get] |
| | The sprite template used by marker instances on the series. More...
|
| |
| virtual SpriteCollection | MarkerSubStyle [get] |
| | This is cyclic used if series have multiple marker sprites. More...
|
| |
| virtual JFunction | Renderer [get] |
| | A function that can be provided to set custom styling properties to each rendered element. It receives (sprite, config, rendererData, index) as parameters. More...
|
| |
| virtual bool | ShowInLegend [get, set] |
| | Whether to show this series in the legend. Defaults to true. More...
|
| |
| virtual bool | ShowMarkers [get, set] |
| | Whether markers should be displayed at the data points along the line. If true, then the marker config item will determine the markers' styling. Defaults to true. More...
|
| |
| virtual SpriteCollection | StyleSpec [get] |
| | Custom style configuration for the sprite used in the series. It overrides the style that is provided by the current theme. More...
|
| |
| virtual SpriteCollection | SubStyle [get] |
| | This is the cyclic used if the series has multiple sprites. More...
|
| |
| virtual string | Title [get, set] |
| | The human-readable name of the series (displayed in the legend). It is superseded by Titles. More...
|
| |
| virtual string[] | Titles [get, set] |
| | The human-readable name of the series (displayed in the legend). It supersedes Title. More...
|
| |
| virtual ChartTip | Tooltip [get, set] |
| | Add tooltips to the visualization's markers. The options for the tips are the same configuration used with Ext.tip.ToolTip. More...
|
| |
| virtual ? bool? | UseDarkerStrokeColor [get, set] |
| | Colors for the series can be set directly through the 'colors' config, or indirectly with the current theme or the 'colors' config that is set onto the chart. These colors are used as "fill color". Set this config to true, if you want a darker color for the strokes. Set it to false if you want to use the same color as the fill color. It supersedes UseDarkerStrokeColorNumber. More...
|
| |
| virtual ? double? | UseDarkerStrokeColorNumber [get, set] |
| | Colors for the series can be set directly through the 'colors' config, or indirectly with the current theme or the 'colors' config that is set onto the chart. These colors are used as "fill color". Set this config to true, if you want a darker color for the strokes. Set it to false if you want to use the same color as the fill color. It is superseded by UseDarkerStrokeColor. More...
|
| |
| virtual string | StoreID [get, set] |
| |
| virtual StoreCollection< Store > | Store [get] |
| | The store to use for this series. If not specified, the series will use the chart's store. More...
|
| |
| SeriesListeners?? | Listeners [get] |
| | Client-side JavaScript Event Handlers More...
|
| |
| string | PropertyName [get] |
| | The IAlias' member More...
|
| |
| override ConfigOptionsCollection | ConfigOptions [get] |
| |
| virtual string | InstanceOf [get] |
| |
| ItemState | State [get] |
| |
| virtual DefaultValueMode | DefaultValueMode [get, set] |
| |
| virtual bool | DesignMode [get] |
| |
| bool | AutoDataBind [get, set] |
| |
| ResourceManager | ResourceManager [get] |
| |
| virtual Control | Owner [get, set] |
| | The Owner Control for this Listener. More...
|
| |
| virtual bool | IsDefault [get] |
| | Does this object currently represent it's default state. More...
|
| |
| bool | IsTrackingViewState [get] |
| |
| EventHandlerList | Events [get] |
| |
| EventHandler | DataBinding |
| |
| Control?? | BindingContainer [get] |
| |
| virtual ConfigItemCollection?? | CustomConfig [get] |
| | Collection of custom js config More...
|
| |
| virtual ConfigOptionsCollection | ConfigOptions [get] |
| |
| virtual ConfigOptionsExtraction | ConfigOptionsExtraction [get] |
| |
| System.Web.Mvc.HtmlHelper?? | HtmlHelper [get, set] |
| |
| ConfigOptionsCollection | ConfigOptions [get] |
| |
| ConfigOptionsExtraction | ConfigOptionsExtraction [get] |
| |
| DefaultValueMode | DefaultValueMode [get, set] |
| |
| string | PropertyName [get] |
| |
Common base class for series implementations that plot values using cartesian coordinates.
 Properties inherited from Ext.Net.Series