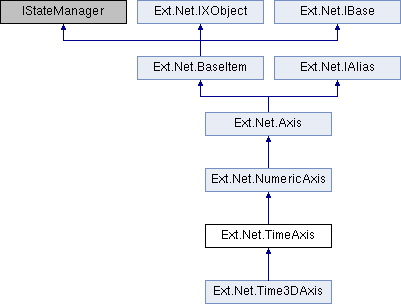
A type of axis whose units are measured in time values. Use this axis for listing dates that you will want to group or dynamically change. If you just want to display dates as categories then use the Category class for axis instead.
More...
|
| override string | InstanceOf [get] |
| | The JavaScript class name More...
|
| |
| override string | Type [get] |
| | The alias More...
|
| |
| virtual string | DateFormat [get, set] |
| | Indicates the format the date will be rendered on. For example: 'M d' will render the dates as 'Jan 30', etc. More...
|
| |
| virtual string? | DateFormatProxy [get] |
| | The proxy to serialize the DateFormat property More...
|
| |
| virtual DateTime | FromDate [get, set] |
| | The starting date for the time axis. More...
|
| |
| virtual DateTime | ToDate [get, set] |
| | The ending date for the time axis. More...
|
| |
| virtual int | Step [get, set] |
| | The number of units for the step. Defaults to 1. More...
|
| |
| virtual DateUnit | StepUnit [get, set] |
| | The unit of the step (day, month, year, etc). Defaults to More...
|
| |
| virtual string | StepProxy [get] |
| |
| override ConfigOptionsCollection | ConfigOptions [get] |
| |
| override string | InstanceOf [get] |
| | The JavaScript class name More...
|
| |
| virtual string | Type [get] |
| | The alias More...
|
| |
| override ConfigOptionsCollection | ConfigOptions [get] |
| |
| override string | InstanceOf [get] |
| | The JavaScript class name More...
|
| |
| virtual bool | AdjustByMajorUnit [get, set] |
| | Whether to make the auto-calculated minimum and maximum of the axis a multiple of the interval between the major ticks of the axis. If majorTickSteps, minimum or maximum configs have been set, this config will be ignored. Defaults to 'true'. More...
|
| |
| DrawBackground | Background [get, set] |
| | The background config for the axis surface. More...
|
| |
| virtual AbstractChart | Chart [get] |
| | The owner Chart More...
|
| |
| virtual string[] | Fields [get, set] |
| | An array containing the names of the record fields which should be mapped along the axis. This is optional if the binding between series and fields is clear. More...
|
| |
| virtual ? int? | Floating [get, set] |
| | If floating is a number, then it's a percentage displacement of the axis from its initial position in the direction opposite to the axis' direction. For instance, '{position:"left", floating:75}' displays a vertical axis at 3/4 of the chart, starting from the left. It is equivalent to '{position:"right", floating:25}'. The FloatingConfig property supersede the Floating one. More...
|
| |
| AxisFloating | FloatingConfig [get, set] |
| | If floating is an object, then floating.value is the position of this axis along another axis, defined by floating.alongAxis, where alongAxis is an ID, an Ext.chart.AbstractChart.axes config index, or the other axis itself. alongAxis must have an opposite alignment. The FloatingConfig property supersede the Floating one. More...
|
| |
| virtual bool | Grid [get, set] |
| | True to enable the grid. Defaults to false More...
|
| |
| AxisGrid | GridConfig [get, set] |
| | The grid configuration object for the Axis style. Can contain stroke or fill attributes. Also may contain an odd or even property in which you only style things on odd or even rows. More...
|
| |
| virtual bool | Hidden [get, set] |
| | Indicate whether to hide the axis. If the axis is hidden, one of the axis line, ticks, labels or the title will be shown and no margin will be taken. The coordination mechanism works fine no matter if the axis is hidden. Defaults to false. More...
|
| |
| virtual string | AxisID [get, set] |
| | The axis id More...
|
| |
| ChartLabel | Label [get, set] |
| | The config for chart label. More...
|
| |
| virtual string | Layout [get, set] |
| | The axis layout config. See Ext.chart.axis.layout.Layout. More...
|
| |
| Limits | Limits [get, set] |
| | The limit lines configuration for the axis. More...
|
| |
| virtual string | LinkedToID [get, set] |
| | Axis (itself, its ID or index) that this axis is linked to. When an axis is linked to a master axis, it will use the same data as the master axis. It can be used to show additional info, or to ease reading the chart by duplicating the scales. It supersedes the LinkedToIndex and LinkedToRef properties. More...
|
| |
| virtual ? int? | LinkedToIndex [get, set] |
| | Axis (itself, its ID or index) that this axis is linked to. When an axis is linked to a master axis, it will use the same data as the master axis. It can be used to show additional info, or to ease reading the chart by duplicating the scales. It supersedes the LinkedToRef and is superseded by the LinkedToID property. More...
|
| |
| virtual string | LinkedToRef [get, set] |
| | Axis (itself, its ID or index) that this axis is linked to. When an axis is linked to a master axis, it will use the same data as the master axis. It can be used to show additional info, or to ease reading the chart by duplicating the scales. It is superseded by the LinkedToID and LinkedToIndex properties. More...
|
| |
| virtual string | LinkedToProxy [get] |
| | The proxy to render the linkedTo config option More...
|
| |
| virtual ? int? | MajorTickSteps [get, set] |
| | Forces the number of major ticks to the specified value. Defaults to 0. More...
|
| |
| virtual int | Margin [get, set] |
| | The margin of the axis. Used to control the spacing between axes in charts with multiple axes. Unlike CSS where the margin is added on all 4 sides of an element, the margin is the total space that is added horizontally for a vertical axis, vertically for a horizontal axis, and radially for an angular axis. Defaults to 0. More...
|
| |
| virtual ? double? | MaxZoom [get, set] |
| | The maximum zooming level for axis. Defaults to 10000. More...
|
| |
| virtual ? double? | Maximum [get, set] |
| | The maximum value drawn by the axis. If not set explicitly, the axis maximum will be calculated automatically. More...
|
| |
| virtual ? double? | MinZoom [get, set] |
| | The minimum zooming level for axis. Defaults to 1. More...
|
| |
| virtual ? double? | Minimum [get, set] |
| | The minimum value drawn by the axis. If not set explicitly, the axis minimum will be calculated automatically. More...
|
| |
| virtual ? int? | MinorTickSteps [get, set] |
| | The number of small ticks between two major ticks. Defaults to 0. More...
|
| |
| virtual bool | NeedHighPrecision [get, set] |
| | Indicates that the axis needs high precision surface implementation. See Ext.draw.engine.Canvas.highPrecision. Defaults to false. More...
|
| |
| virtual Position | Position [get, set] |
| | Where to set the axis. Available options are left, bottom, right, top, radial and angular. More...
|
| |
| virtual string | PositionProxy [get] |
| |
| string | PropertyName [get] |
| | The member of IAlias More...
|
| |
| virtual bool | ReconcileRange [get, set] |
| | If 'true' the range of the axis will be a union of ranges of all the axes with the same direction. Defaults to 'false'. More...
|
| |
| virtual JFunction | Renderer [get] |
| | Allows to change the text shown next to the tick. More...
|
| |
| virtual string | Segmenter [get, set] |
| | The segmenter config. See Ext.chart.axis.segmenter.Segmenter. More...
|
| |
| AxisSprite | Style [get, set] |
| | The style for the axis line and ticks. Refer to the Ext.chart.axis.sprite.Axis. More...
|
| |
| virtual string | Title [get, set] |
| | The "text" of the title sprite. More...
|
| |
| Sprite | TitleConfig [get, set] |
| | The title style. More...
|
| |
| virtual int | TitleMargin [get, set] |
| | The margin around the axis title. Unlike CSS where the margin is added on all 4 sides of an element, the titleMargin is the total space that is added horizontally for a vertical title and vertically for an horizontal title, with half the titleMargin being added on either side. Defaults to 4. More...
|
| |
| virtual double[] | VisibleRange [get, set] |
| | Specify the proportion of the axis to be rendered. The series bound to this axis will be synchronized and transformed. Defaults to [0, 1]. More...
|
| |
| AxisListeners?? | Listeners [get] |
| | Client-side JavaScript Event Handlers More...
|
| |
| override ConfigOptionsCollection | ConfigOptions [get] |
| |
| virtual string | InstanceOf [get] |
| |
| ItemState | State [get] |
| |
| virtual DefaultValueMode | DefaultValueMode [get, set] |
| |
| virtual bool | DesignMode [get] |
| |
| bool | AutoDataBind [get, set] |
| |
| ResourceManager | ResourceManager [get] |
| |
| virtual Control | Owner [get, set] |
| | The Owner Control for this Listener. More...
|
| |
| virtual bool | IsDefault [get] |
| | Does this object currently represent it's default state. More...
|
| |
| bool | IsTrackingViewState [get] |
| |
| EventHandlerList | Events [get] |
| |
| EventHandler | DataBinding |
| |
| Control?? | BindingContainer [get] |
| |
| virtual ConfigItemCollection?? | CustomConfig [get] |
| | Collection of custom js config More...
|
| |
| virtual ConfigOptionsCollection | ConfigOptions [get] |
| |
| virtual ConfigOptionsExtraction | ConfigOptionsExtraction [get] |
| |
| System.Web.Mvc.HtmlHelper?? | HtmlHelper [get, set] |
| |
| ConfigOptionsCollection | ConfigOptions [get] |
| |
| ConfigOptionsExtraction | ConfigOptionsExtraction [get] |
| |
| DefaultValueMode | DefaultValueMode [get, set] |
| |
| string | PropertyName [get] |
| |
A type of axis whose units are measured in time values. Use this axis for listing dates that you will want to group or dynamically change. If you just want to display dates as categories then use the Category class for axis instead.
 Public Member Functions inherited from Ext.Net.NumericAxis